How to Carry Out a Quick Design Assessment - An Example
Poor design quality and huge technical debt are common issues perceived in real-life software projects. Carrying out a software design quality assessment effectively and adopting the recommendations from it could improve the design quality. A comprehensive design assessment requires us to know the requirements in detail and weight different design aspects in accordance with the requirements. The amount of effort and time required to carry out a comprehensive design assessment could be quite high. However, a quick and effective design assessment can be carried out by measuring standard code quality metrics and by identifying design and implementation smells.
Let us take NRefactory as an example and perform a software design quality assessment. NRefactory is an open-source library that parses C# code, provides Abstract Syntax Tree (AST), and offers many features relevant for static code analysis.
A software design assessment must reveal the following:
- Total number of design smells and design smell density
- Total number of implementation smells and corresponding smell density
- A holistic picture of code quality metrics violations, and
- Code duplication
There are a few tools to measure various metrics for C# code such as Source Monitor (Free), Gendarme (Free), NDepend (Commercial; free trial for 14 days), and Designite (Commercial; trial version free forever). For implementation and design smells detection, NDepend provides CQLinq to create rules to detect some of the smells; however, Designite supports detection of a wide variety of implementation and design smells explicitly. Therefore, I am going to use Designite to analyze the project under analysis in this article.
To start the analysis, I selected NRefactory.sln in Designite (menu “Analysis” -> “Analyze a solution”). Designite analyzed all the projects in the solution and provided a summary. The total LOC (Lines of Code) in all the projects is approximately 395 thousand with more than 2100 classes and 15 thousand methods. It also revealed that the total design smell density for all the analyzed projects is 11.07. Smell density shows how many design smells were found per thousand lines of code on an average. Further, the total code duplication is 9.63 % which is on the higher side (although there is no one globally accepted number for code duplication, anything above 3% could be considered high).
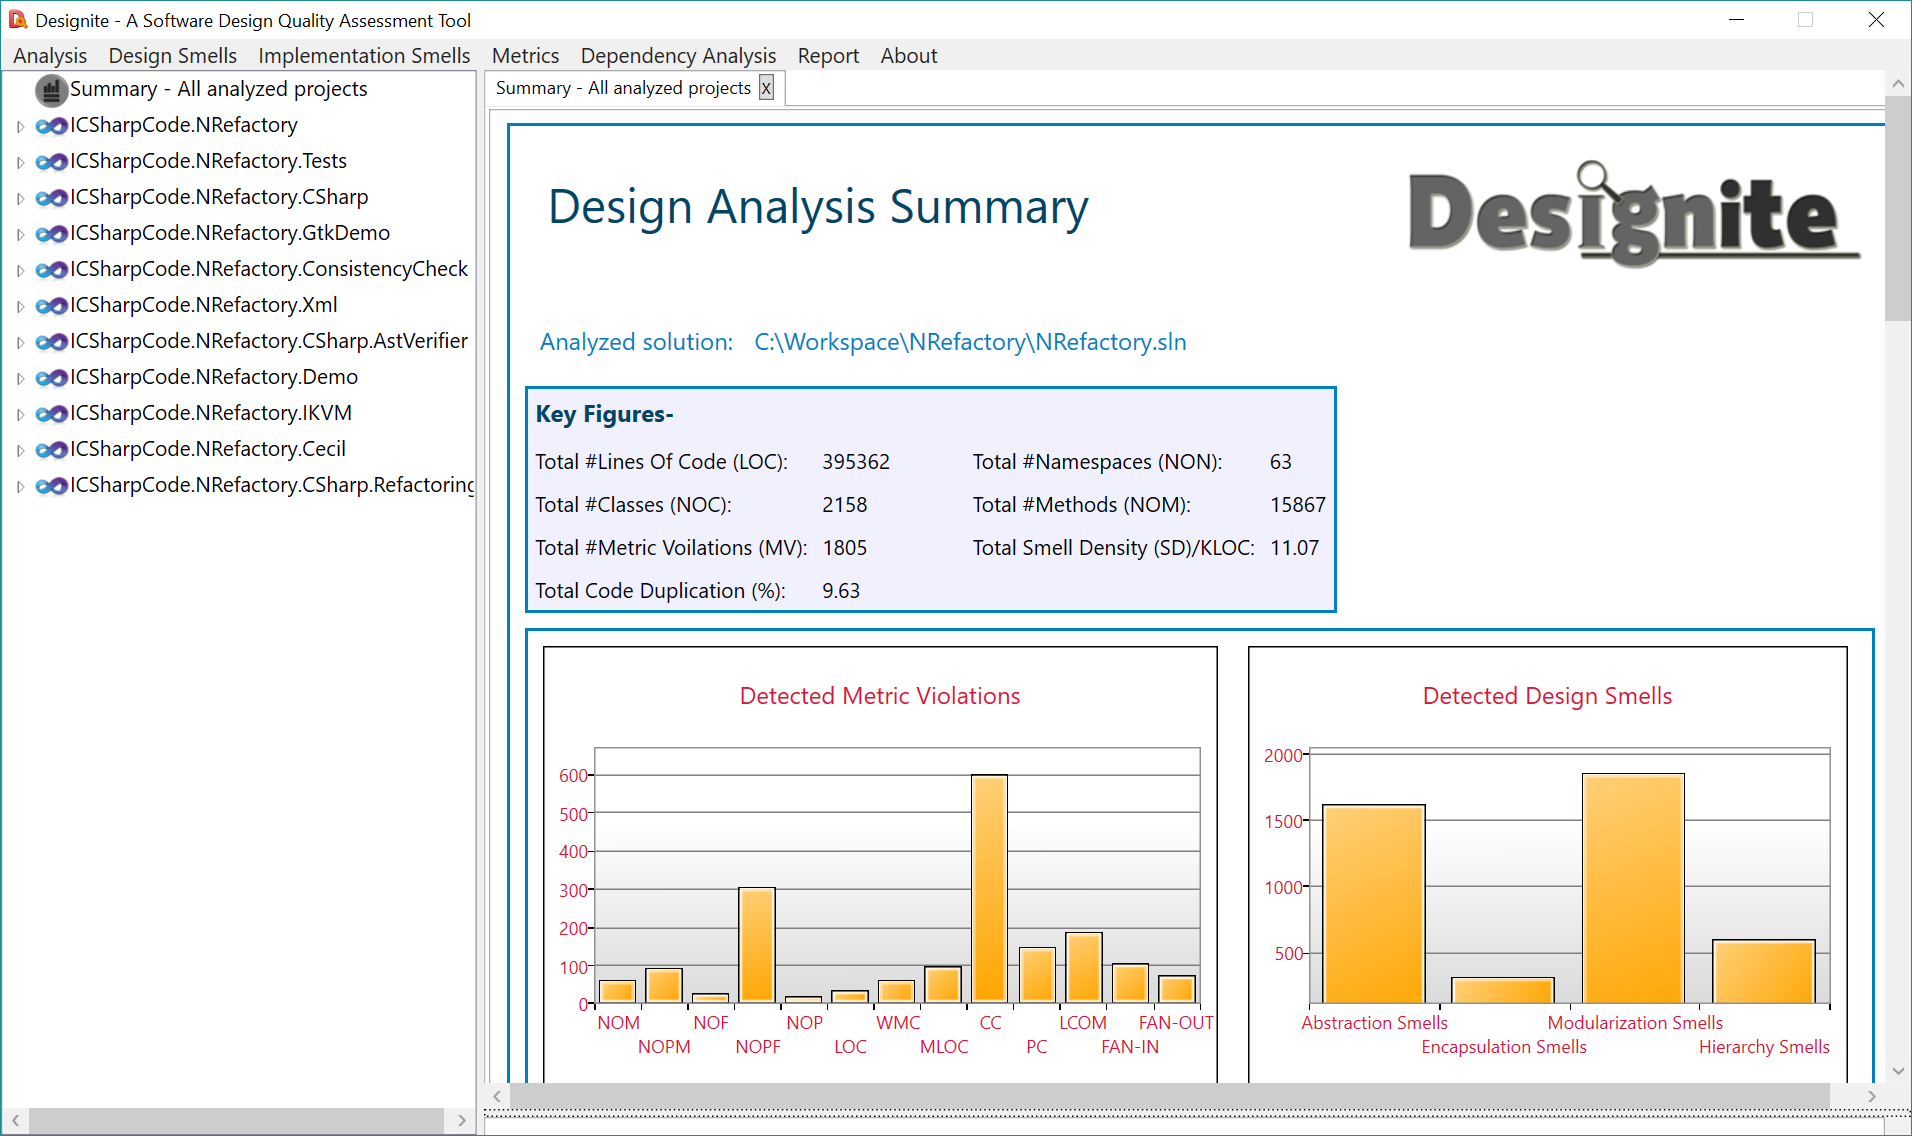 Summary of the analysis produced by Designite
There are 13 C# projects in the NRefactory solution. I am going to focus on one significant project “ICSharpCode.NRefactory” in this article. Design smell density for this project is 7 and code duplication is 14.62% (very high!).
Design smells
The tool detected 230 design smells in this project. Let us take a closer look at them. Abstraction smells are more than 50% of total detected design smells. Two dominant number of smells in this category are Duplicate Abstraction and Unutilized Abstraction.
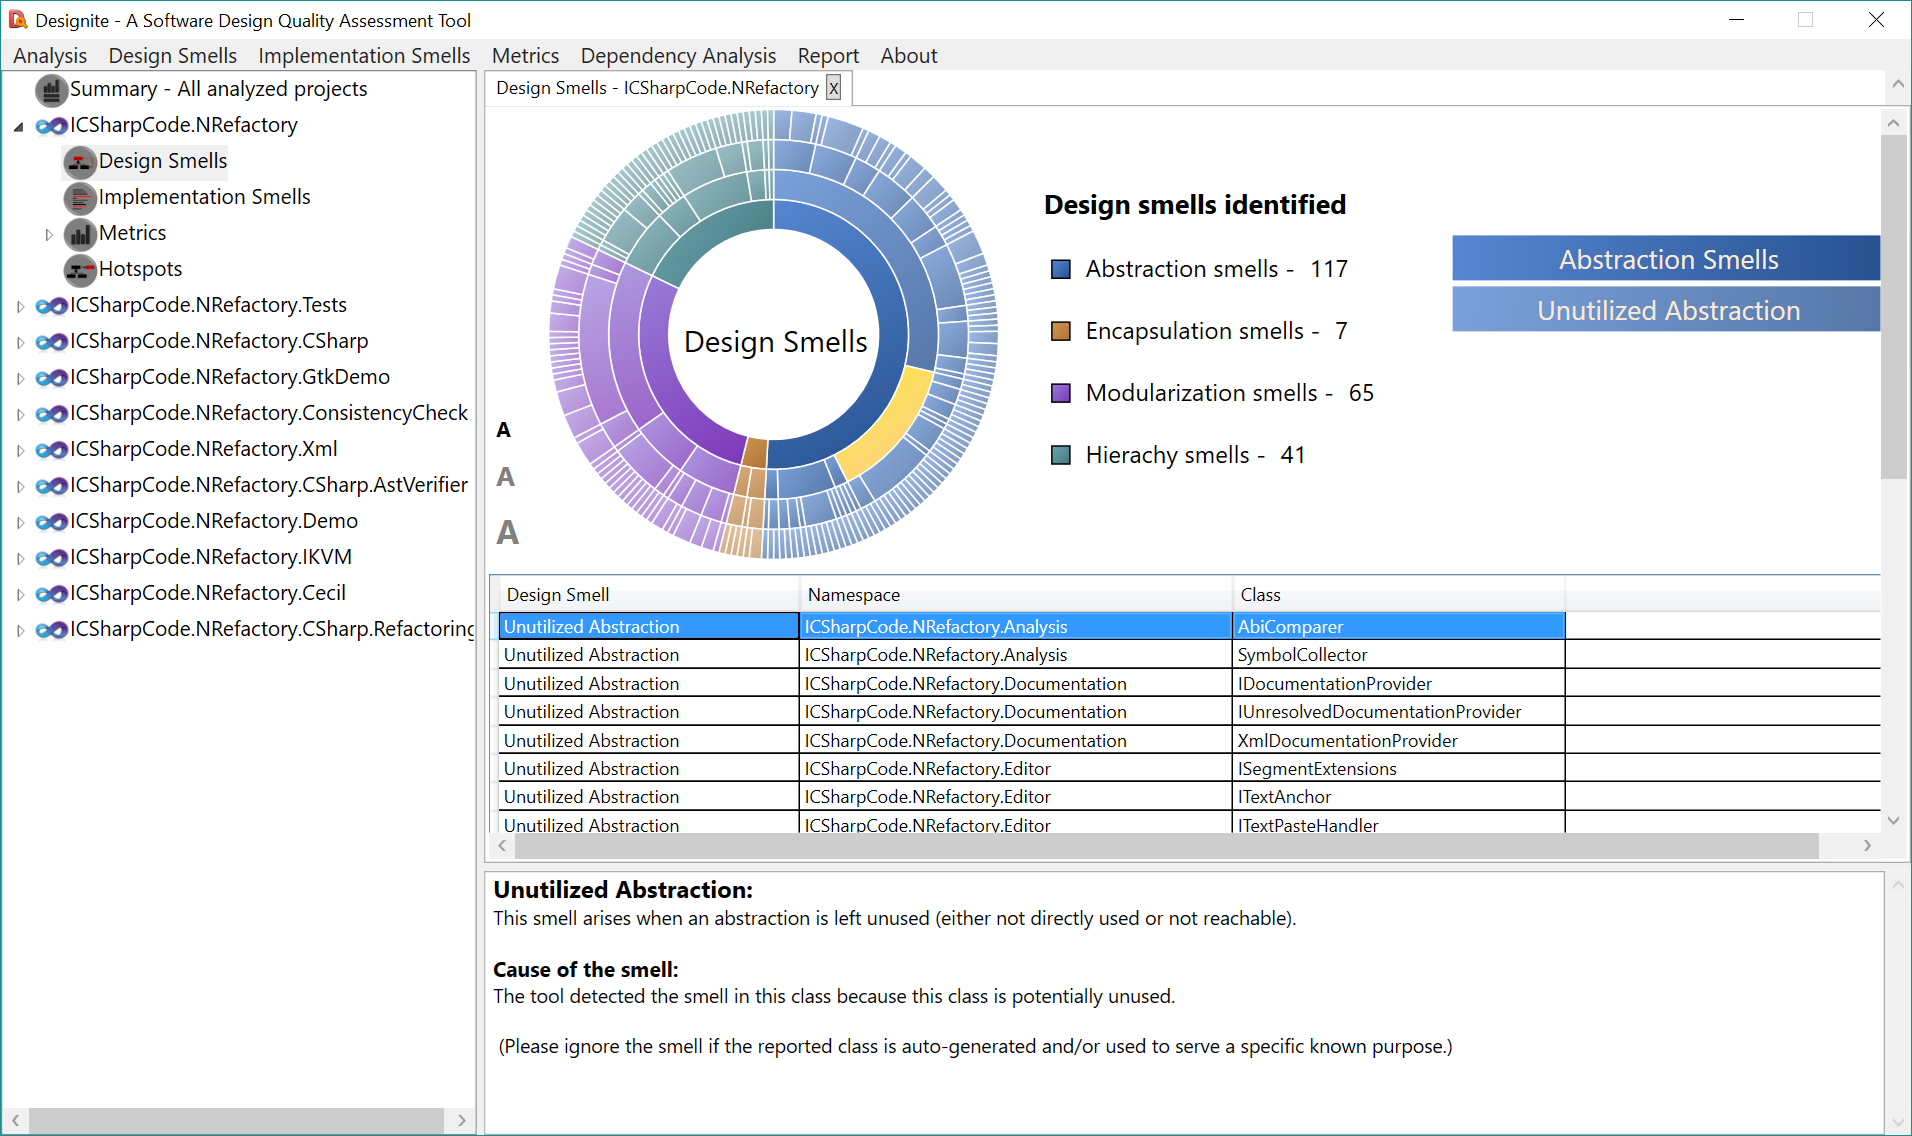 Detected design smells shown in a sunburst diagram
Given the high percentage of code duplication, it is obvious to see a high number of Duplicate Abstraction. The code clone revealed in one of the reported Duplicate Abstraction instances is TypeGraph[lines 1-24] and TypeGraphNode [1-24]. However, if we open the files in which this clone has been detected, we can observe that it is due to the file header text (including copyright text). We can safely ignore such smells. However, another reported instance of Duplicate Abstraction is a genuine code duplication where the file containing UnicodeNewline has a clone [165-206, 218-259].
We can use sunburst diagram to filter the detected smells at different granularity (Principle, Smell, Namespace, and Class). Let us take a look at another abstraction smell reported in high volume – Unutilized Abstraction. This smell occurs when an abstraction is not used across the solution. For instance, the class AbiComparer has not been used anywhere in the analyzed source code.
The tool detected 39 Cyclically-dependent Modularization smells also. One of the examples of such a cycle is IUnresolvedEvent, IType, TypeParameterSubstitution, IMember, and ITypeResolveContext.
There are 230 design smells detected in the project. Now, how can we choose a subset of classes that requires the refactoring first? The hotspots analysis of the tool revealed 9 classes as hotspots that we may choose to refactor first.
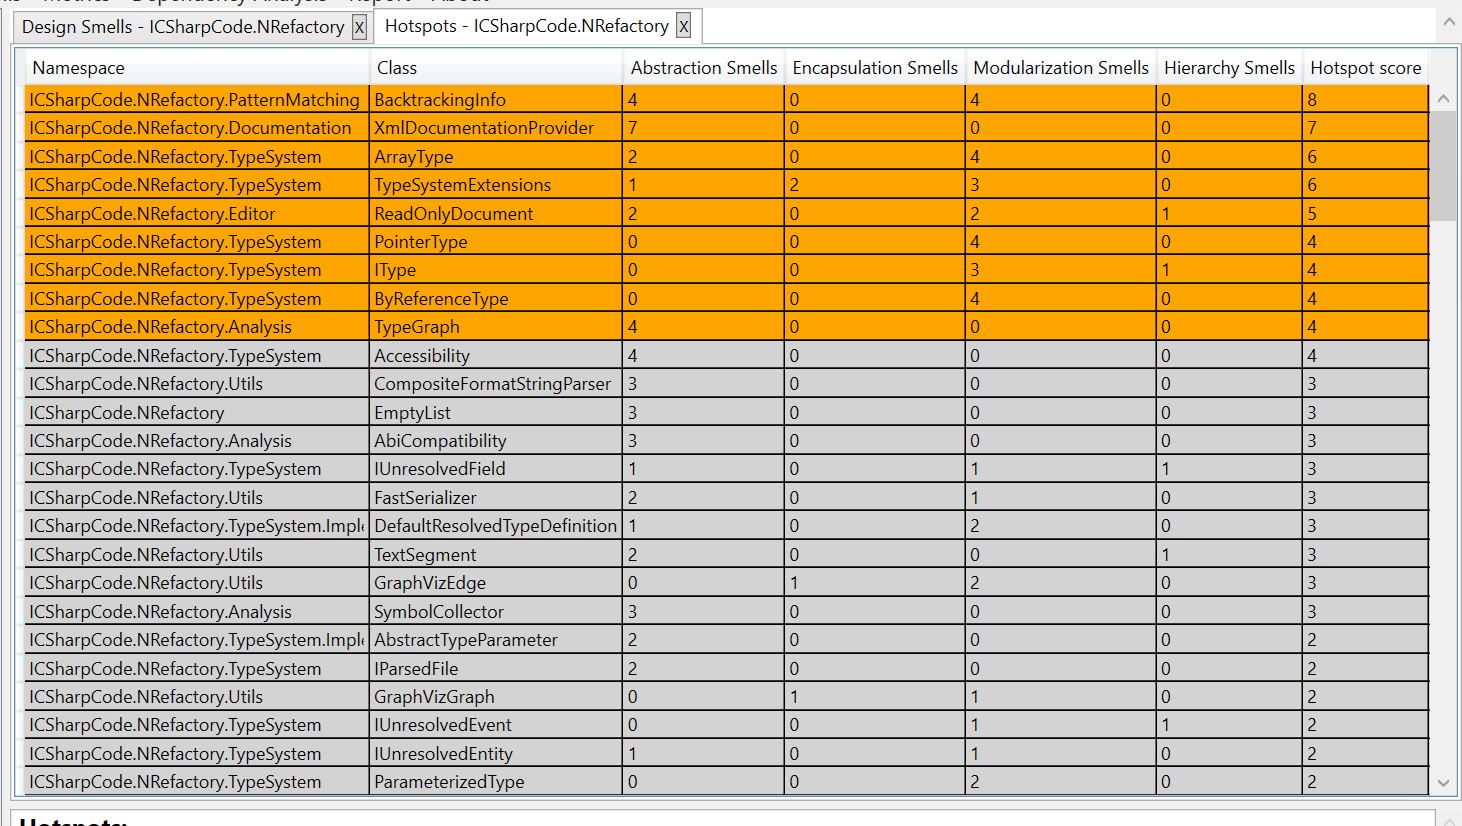 Hotspot analysis
Implementation smells
Smells could arise at various granularities (implementation, design, and architecture); categorization of smells depends on the factors such as scope and their impact on the rest of the system. Implementation smells concern mainly with the implementation specific quality issues. Let us see how the software under analysis fairs with implementation smells.
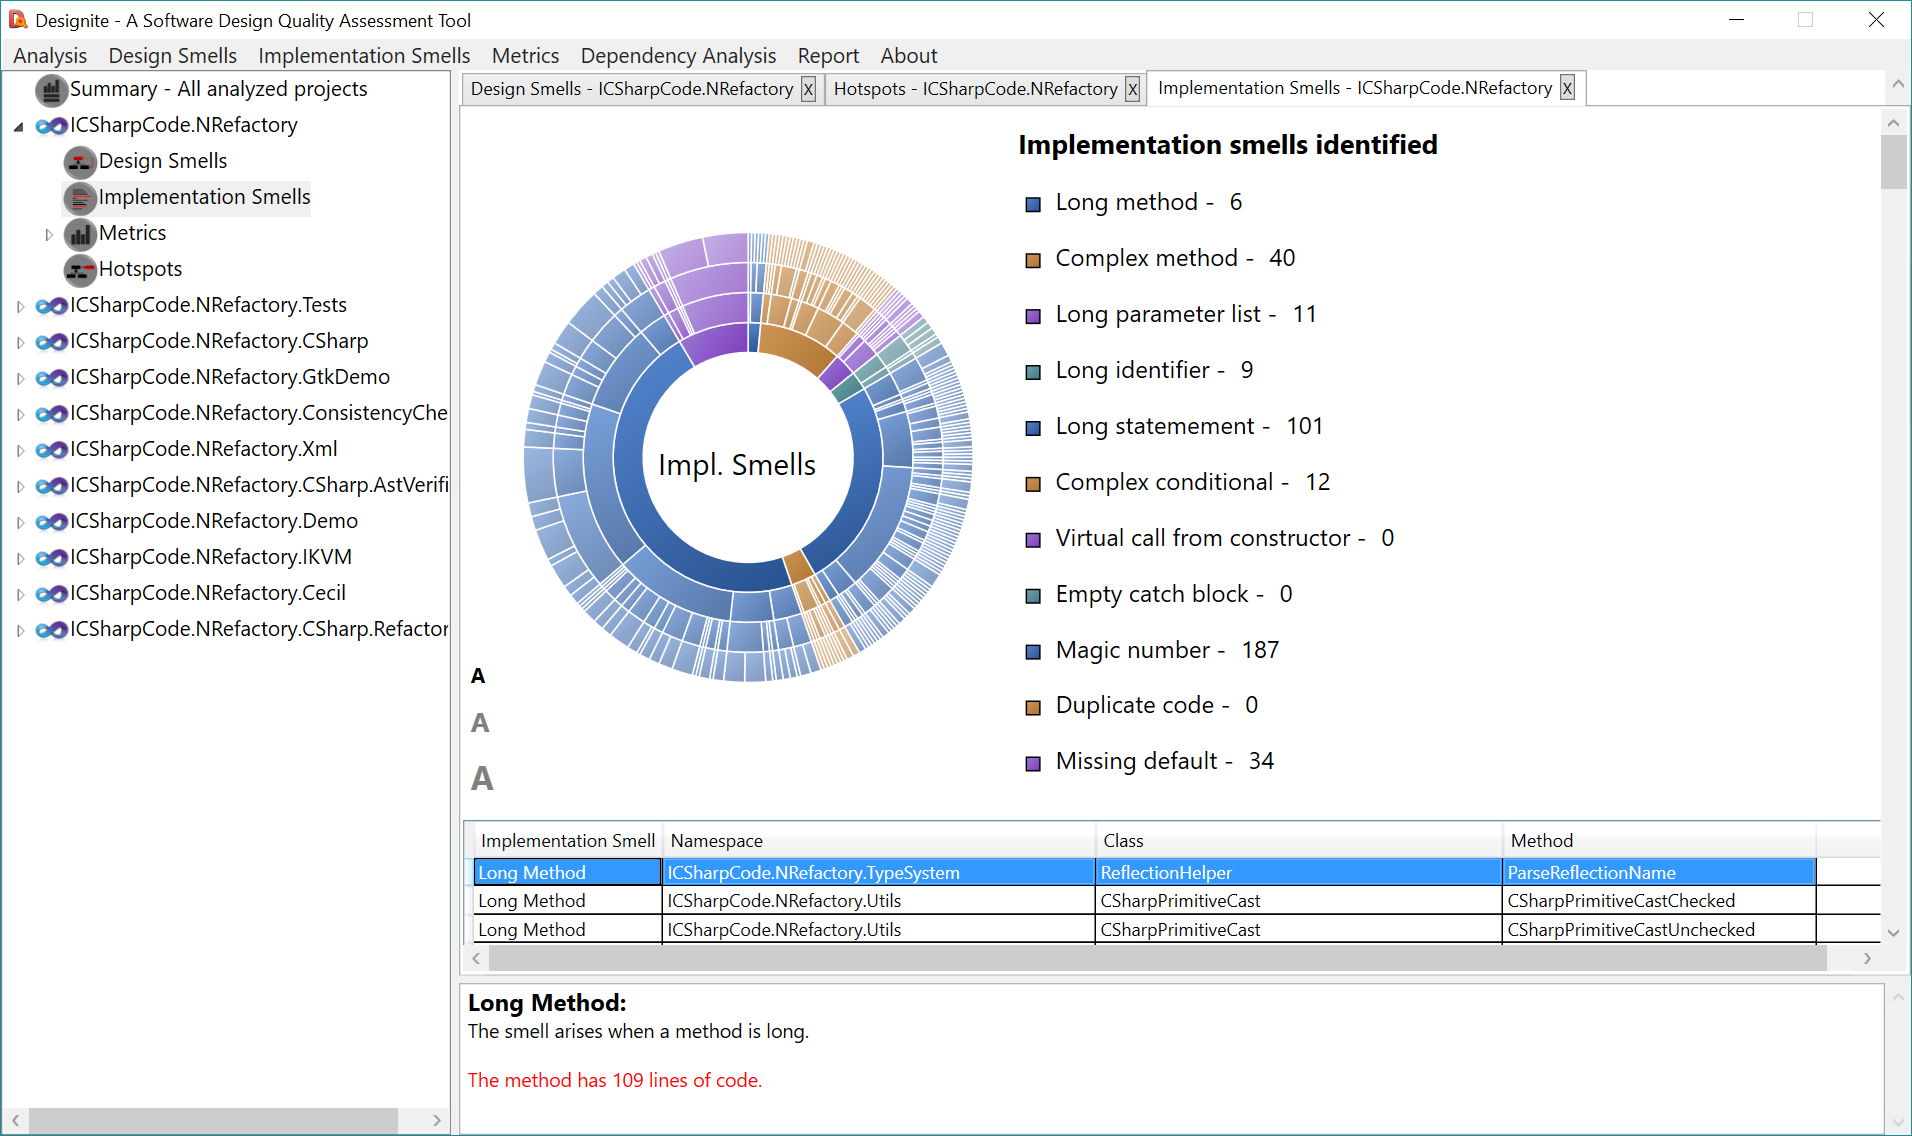 Detected implementation smells shown in a sunburst diagram
The tool has detected 400 implementation smells belonging to 8 types of implementation smells with implementation smell density 12.7 (the project has 31286 LOC). What do you think about the smell density? Is it high or low? Well, it is better to compare smell density associated with two (or more) versions of a software rather than drawing a conclusion based on a smell density threshold.
Magic Number (187 instances) and Long Statement (101 instances) are most frequently implementation smells in the project. One example of detected Magic Number smell is given below:
foreach (char c in key) { h = (h << 5) - h + c;}
Just looking at the snippet, it is not clear why the literal '5' has been chosen as a shift offset; that’s why it’s a magic number.
Metrics
Let us explore a few code quality metrics and observe how the project fairs with them. It’s important to observe a holistic view of the project with respect to a metric since it provides a complete picture of code quality of the project. The tool provides a pie-chart with respect to each metric.
The first metric is WMC (Weighted Methods per Class) which is the sum of cyclomatic complexities of all the methods in the class.
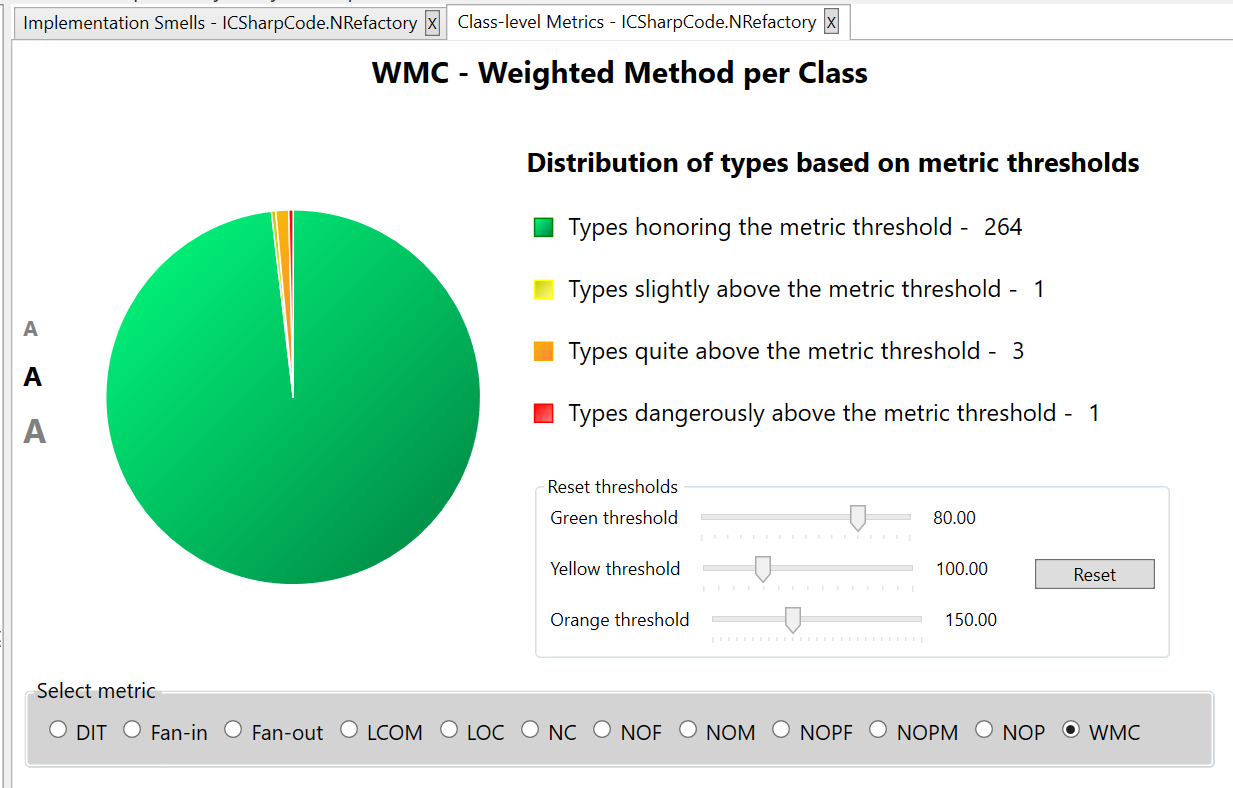 Pie chart showing health of the project from a metric perspective
We can observe that most of the classes are in the green zone (which is great). Only 1 class is in the yellow zone (metric value slightly above the threshold), 3 classes are in the orange zone (metric value quite above the threshold), and only 1 class is in the red zone (metric value dangerously above the threshold).
Let us view the project status with respect to class LOC. There are only 4 and 1 classes in the yellow and orange zone respectively. Based on this information, the project is maintained well at least from the code quality metrics that we have considered.
Trend Analysis
It is relevant to observe how the project evolved from code quality perspective. One way to carry out trend analysis is to generate code quality information (smells and metrics) and then compare manually. Thankfully, we don’t have to do this. Designite allows us to carry out trend analysis and presents the smells trend in a visually pleasing manner.
I have chosen 9 different versions of the project; details of the chosen versions are given in the following table:
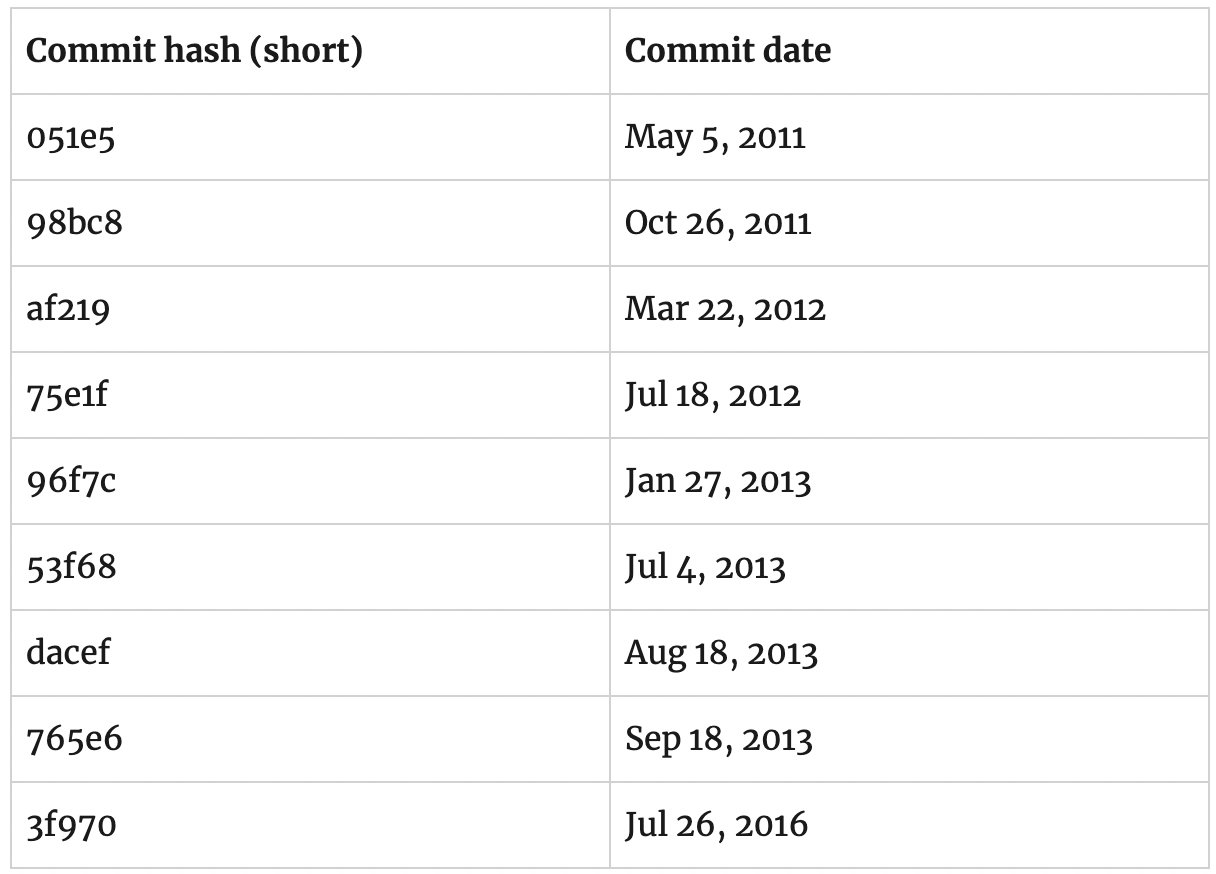 Versions analyzed
Designite produced the following trend analysis graph for the above versions.
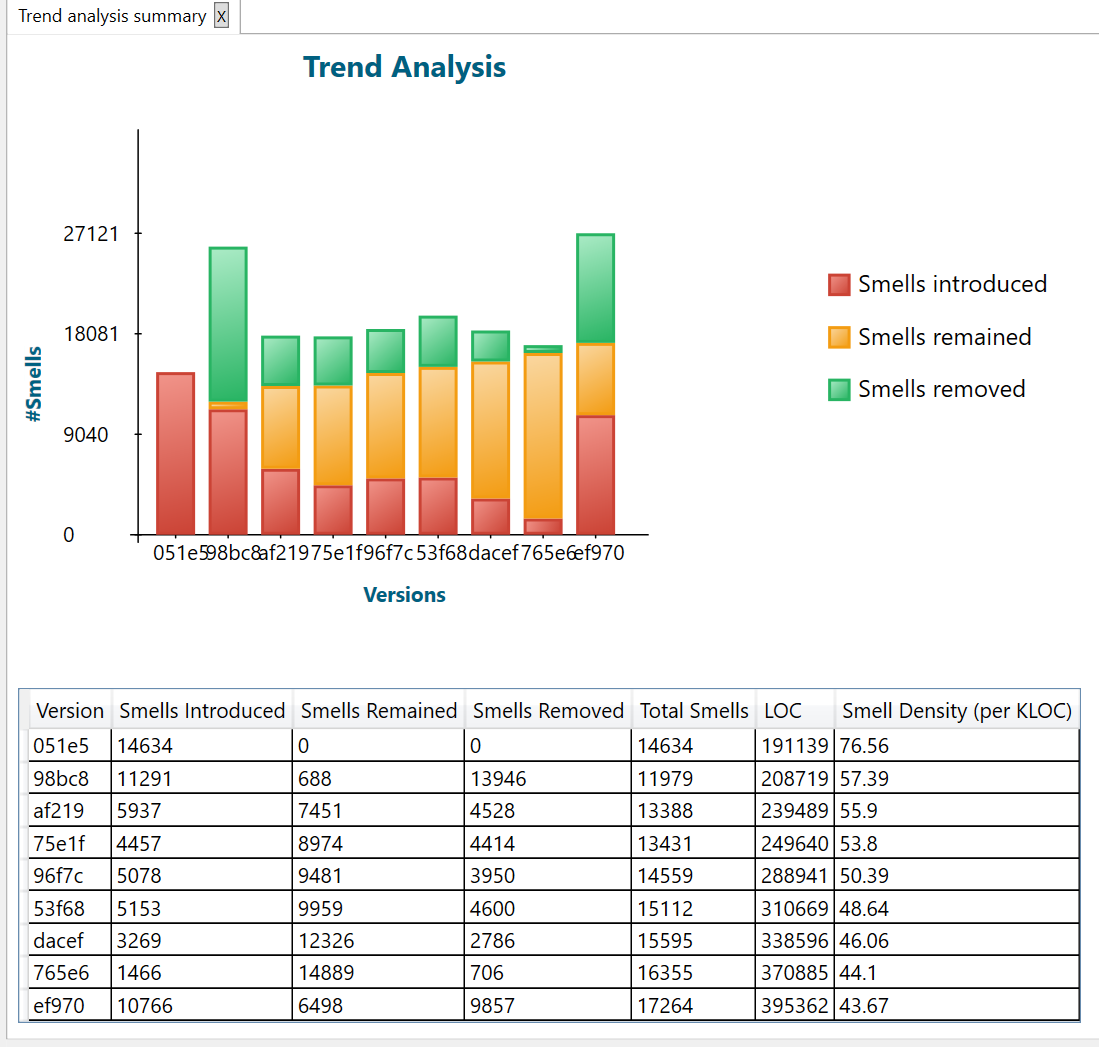 Trend analysis showing evolution of the project from smells perspective
It is interesting to observe that as the project size increased from 191 KLOC to 395 KLOC, smell density has constantly decreased from 76.56 to 43.67. It’s a great sign of improvement. However, the above results are for the whole solution. If we want to see trend analysis information specific to the project that I have chosen in this article, we can use the console application of Designite for the customized analysis. The following table, which is generated by the Designite console application, shows trend information specific to the project under analysis.
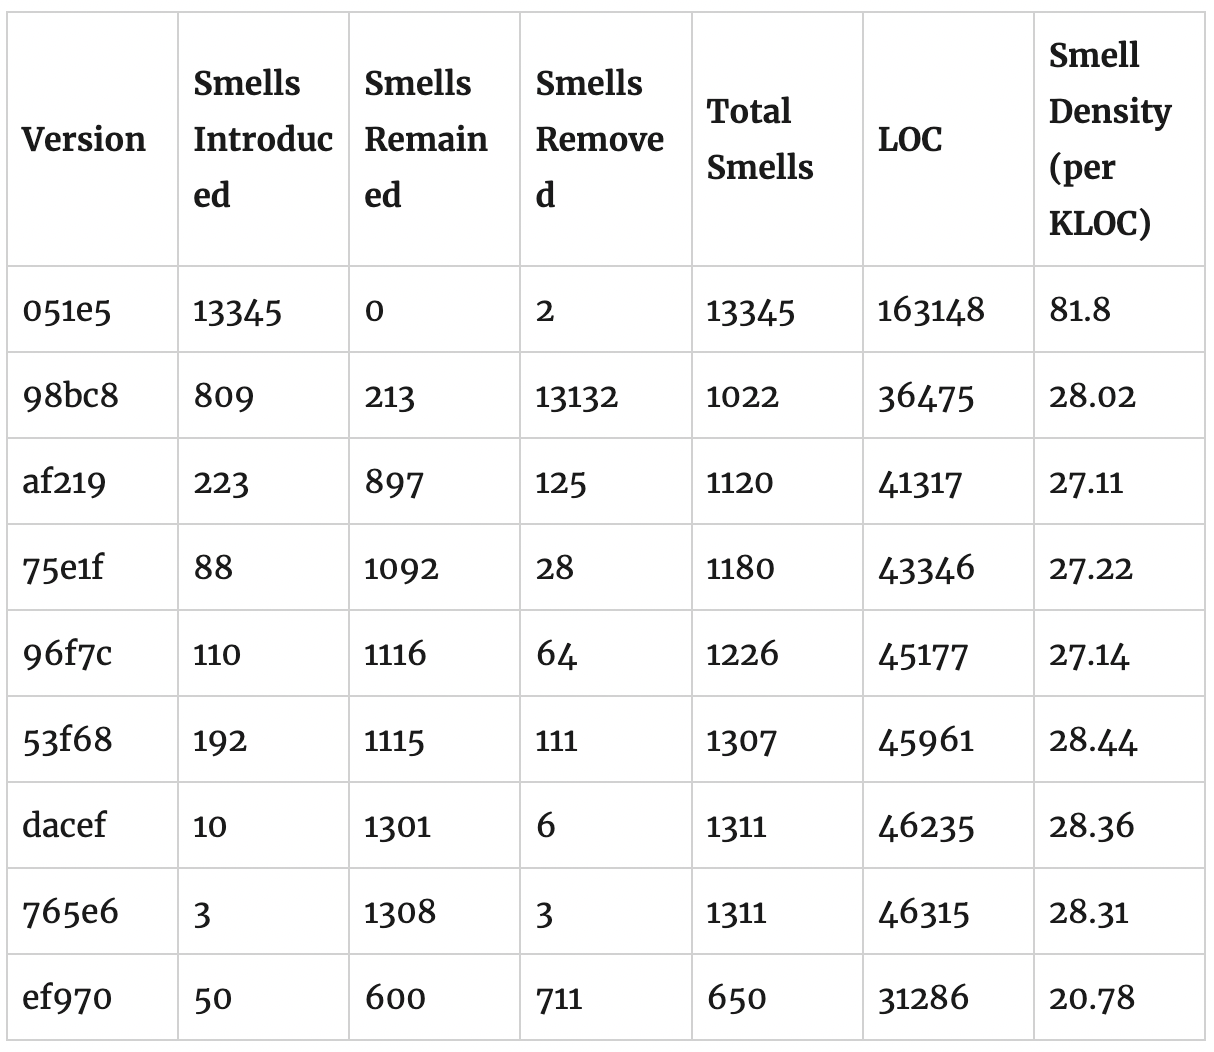 Summary of the trend analysis produced by Designite
The table shows interesting information. In the version 051e5, smell density was very high (81.8). Later, it looks like that the project was broken into other projects and considerable refactoring had been performed. It is very obvious from the transition from version 051e5 to version 98bc8 where smell density reduced drastically from 81.8 to 28.02. For rest but the last of the analyzed versions, the smell density remains almost stable. In the latest version of the project, the code quality improved even further as shown by the smell density (20.78).
To summarize, we observed the following during the above assessment:
- Code duplication is quite high; however, a majority of clone instances are coming from file headers and copyright declarations.
- There are many Unutilized Abstraction and Cyclically-dependent Modularization smell instances which need be refactored.
- Long Statement and Magic Number are the two most frequently occurring implementation smells in the project.
- The project does very well from well-known code quality metrics perspective.
- The trend analysis shows that the code quality of the project is constantly improving.
![]()
Visit Designite's website to know more about the tool.

